Minimum Payment Statistics: How Long Credit Card Debt Really Lasts
Minimum payments are designed to be easy to make — and, by the same design, to keep you in debt for decades. To put exact numbers on that, we simulated minimum-payment payoff month by month for every common combination of balance and APR, using the two minimum formulas US card issuers actually use. All figures below come from those simulations; the methodology is public, and you can reproduce any cell of these tables with our credit card payoff calculator.
Key statistics
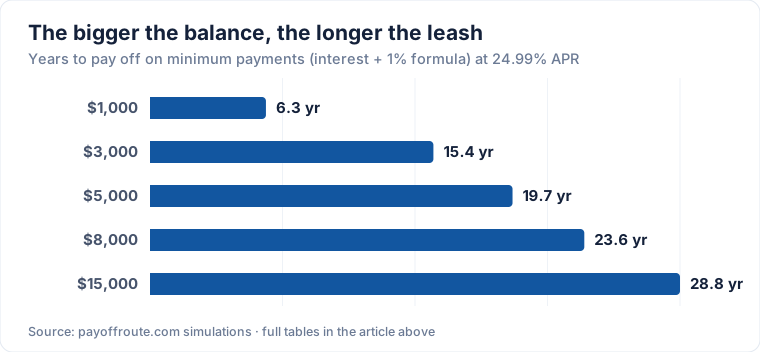
- A $5,000 balance at 24.99% APR (a common rate on new card offers — the Federal Reserve’s G.19 release puts the average APR on accounts actually paying interest at 21.5% as of Q1 2026, with new-card and retail-card offers typically higher) takes 19.7 years to pay off on minimum payments and costs $9,278 in interest — 186% of the original balance.
- An $8,000 balance at 24.99% takes 23.6 years and $15,525 in interest.
- A $15,000 balance takes 28–30 years at today’s rates — longer than most mortgages.
- Under the older flat-2% minimum formula, any balance above roughly $1,200 at 24.99% APR or higher never pays off at all: the payment starts below the monthly interest charge. Only the $25 floor rescues balances smaller than that.
- Even a small $1,000 balance at 29.99% costs $1,268 in interest (127% of the debt) on minimums — and $7,109 (711%) under the flat-2% formula.
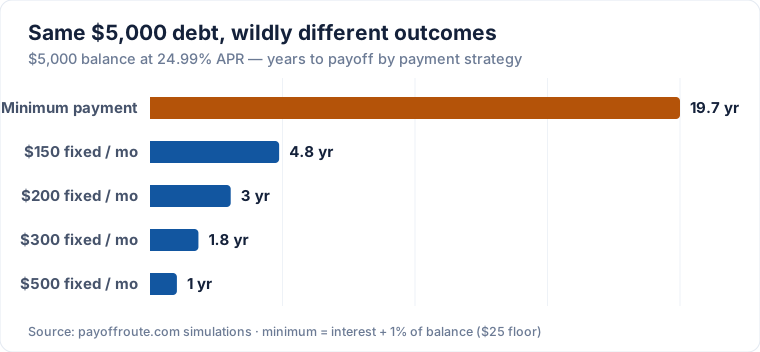
- Replacing minimums with a fixed $200/month on a $5,000 balance at 24.99% cuts the payoff from 19.7 years to 3.0 years and the interest from $9,278 to $2,135.
(Feel free to cite these figures with a link to this page.)
These numbers matter at national scale: Americans carry about $1.25 trillion in credit card balances as of Q1 2026, per the New York Fed’s Household Debt and Credit Report — just off the record $1.28 trillion set the previous quarter. Every percentage point of that total riding on minimum payments is billions of dollars in slow-motion interest.
The two minimum formulas — and why one is a trap
US issuers compute minimum payments in one of two main ways:
- Interest + 1% of the balance (floor ~$25). The payment always exceeds that month’s interest by 1% of your balance, so the debt shrinks — glacially. This is the more common structure today, and it’s what our main tables model.
- A flat 2–3% of the balance (floor ~$25). At 2%, this is arithmetic on a knife’s edge: 24.99% APR works out to about 2.08% of your balance in monthly interest — more than the 2% payment. The balance grows every month. This negative-amortization trap is why regulators pushed issuers toward formula 1 after 2003, but flat-percentage minimums still exist.
Your card’s formula is in the Schumer box of your agreement, under “How is my minimum payment calculated?” — it is worth the two minutes to check.
Years to pay off on minimum payments (interest + 1% formula)
| Balance | 18% APR | 22% APR | 24.99% APR | 29.99% APR |
|---|---|---|---|---|
| $1,000 | 5.2 yr | 5.8 yr | 6.3 yr | 7.1 yr |
| $3,000 | 14.3 yr | 15.0 yr | 15.4 yr | 16.2 yr |
| $5,000 | 18.5 yr | 19.2 yr | 19.7 yr | 20.4 yr |
| $8,000 | 22.4 yr | 23.1 yr | 23.6 yr | 24.3 yr |
| $15,000 | 27.6 yr | 28.3 yr | 28.8 yr | 29.5 yr |
Total interest paid on minimum payments (interest + 1% formula)
| Balance | 18% APR | 22% APR | 24.99% APR | 29.99% APR |
|---|---|---|---|---|
| $1,000 | $539 (54%) | $766 (77%) | $948 (95%) | $1,268 (127%) |
| $3,000 | $3,539 (118%) | $4,433 (148%) | $5,113 (170%) | $6,266 (209%) |
| $5,000 | $6,539 (131%) | $8,100 (162%) | $9,278 (186%) | $11,264 (225%) |
| $8,000 | $11,039 (138%) | $13,600 (170%) | $15,525 (194%) | $18,762 (235%) |
| $15,000 | $21,539 (144%) | $26,433 (176%) | $30,103 (201%) | $36,256 (242%) |
Percentages show interest as a share of the original balance — above 100% means you paid more in interest than you ever borrowed.
The flat-2% trap: balances that never pay off
Rerun the same simulation with the flat-2% formula and the table falls apart at today’s rates:
| Balance | 18% APR | 22% APR | 24.99% APR | 29.99% APR |
|---|---|---|---|---|
| $1,000 | 5.2 yr | 6.1 yr | 7.3 yr | 27.1 yr |
| $3,000 | 21.5 yr | 47.2 yr | never | never |
| $5,000 | 29.5 yr | 68.1 yr | never | never |
| $8,000 | 36.9 yr | 87.3 yr | never | never |
| $15,000 | 46.8 yr | never | never | never |
“Never” is not rhetorical. On a $5,000 balance at 24.99%, the first month’s interest is $104.13 while the first 2% minimum payment is $102.08 — the payment doesn’t even cover the interest, so the balance rises, next month’s interest rises with it, and the gap widens forever. The only reason $1,000 balances escape is the $25 payment floor, which eventually overpowers the interest on a small enough debt — after 27 years.
What a fixed payment does instead
The escape is almost embarrassingly simple: stop letting the payment shrink. Pay a fixed amount every month — even a modest one — and the mathematics reverses. For the benchmark $5,000 balance at 24.99%:
| Monthly payment | Debt-free in | Total interest | Interest saved vs minimum |
|---|---|---|---|
| Minimum (interest + 1%) | 19.7 yr | $9,278 | — |
| $150 fixed | 4.8 yr | $3,622 | $5,656 |
| $200 fixed | 3.0 yr | $2,135 | $7,143 |
| $300 fixed | 1.8 yr | $1,206 | $8,072 |
| $500 fixed | 1.0 yr | $666 | $8,612 |
The first minimum payment on that balance is about $154 — so the $150 row means: keep paying roughly what the first bill asked, never less, and two decades of debt become under five years. The minimum-payment trap isn’t the size of the payment; it’s that the payment shrinks as the balance falls, keeping you on the hook as long as possible.
Why it’s built this way
A minimum payment is a loss-prevention number, not a payoff plan: it’s calibrated to keep the account current (and the interest flowing) at the lowest payment you’ll tolerate. Since the 2009 CARD Act, US statements must carry a minimum-payment warning box showing how long minimum-only payoff takes and a 3-year-payoff amount next to it — issuers’ own legally mandated disclosure (see the CFPB’s explainer on the statement payoff disclosures) that the minimum is not how you get out. Our numbers above simply extend that disclosure to every balance and rate.
Methodology
Simulations run month by month: interest accrues at APR ÷ 12 on the current balance, then the payment is applied. Minimum formulas: (1) monthly interest + 1% of balance, $25 floor; (2) 2% of balance, $25 floor. Payments never exceed the remaining balance; simulations cap at 100 years, reported as “never.” No new purchases, fees, or rate changes are modeled — real-world results are worse if you keep spending on the card. Full details on our methodology page. To test your own cards — with multiple balances and payoff strategies — use the credit card payoff calculator; if you’re weighing a 0% transfer to break the cycle, the balance transfer calculator compares it honestly, fee included.
Run your own numbers
Credit Card Payoff Calculator
Compare the snowball and avalanche strategies across all your cards and see how much interest each plan saves.
Open calculator →Balance Transfer Calculator
Is a 0% balance transfer worth the fee? Compare keeping your card vs transferring, month by month.
Open calculator →Loan Payoff Calculator
See how much sooner you’ll be debt-free and how much interest you save by adding extra monthly or one-time payments to any loan.
Open calculator →Disclaimer: This article is for educational purposes only and is not financial advice. Figures are computed with the models described on our methodology page; actual loan terms depend on your lender and circumstances.