The IUL Column Your Agent Did Not Show You Earns −9.98% a Year
Search “max funded IUL” and nine of the first ten results sell indexed universal life. Search “IUL vs 401k” and the SERP’s consensus answer is “do both!” — which is the answer a commission gives, not an answer arithmetic gives.
Now look for the people who would normally settle this.
The CFPB has written nothing about IUL — and it never will. Insurance is regulated by the states, not the federal consumer bureau. The regulator that would ordinarily arrive is jurisdictionally barred from the room. This vacuum is not an oversight. It is permanent.
Bankrate and NerdWallet have written about IUL, and the coverage is descriptive to warm. NerdWallet’s explainer advises the reader to find a life insurance agent with a CLU designation to help navigate the buying process. Both sites review the carriers that sell IUL. Neither can print “the cap is discretionary and the insurer can cut it” beside a life-insurance lead unit, because that lead unit is what pays for the page.
The sellers cannot be honest. The giants cannot afford to be. The regulator is not allowed in.
We sell nothing. Every figure below is reproducible in the IUL calculator.
We did not model the policy. We read the document.
Every “IUL calculator” on the internet simulates a policy for you, projecting 6.5% growth and today’s caps forever. That is an assumption dressed as a fact, and we will not publish one. A policy’s internals — the cap, the participation rate, the cost of insurance, the crediting method — are proprietary and vary by carrier.
Your illustration already contains the real numbers, and it contains them twice.
Key findings
- Every illustration prints two columns. The illustrated one assumes everything goes well. The guaranteed one is what the insurer is contractually obliged to deliver.
- The illustrated column earns 3.21% a year. $240,000 paid in becomes $340,000 in twenty years.
- The guaranteed column earns −9.98% a year. The same $240,000 becomes $95,000.
- The gap between the two is $245,000 — on a policy you paid $240,000 into.
- Buying term and investing the difference beats even the optimistic column by $129,325, after taxing every dollar of the gain.
- The break-even return is 3.95%. Your investments need less than four percent to beat the column the agent showed you.
- The cap costs more than the floor saves. The floor helps in a down year; the cap bites in every good one — and it is the insurer’s to lower.
The two columns
| Illustrated | Guaranteed | Term + invest | |
|---|---|---|---|
| Out of pocket, per year | $12,000 | $12,000 | $12,000 |
| Of which, insurance | bundled | bundled | $350 (term) |
| Of which, invested | — | — | $11,650 |
| Death benefit | $500,000 | $500,000 | $500,000 |
| Paid in over 20 years | $240,000 | $240,000 | $240,000 |
| Value at year 20 | $340,000 | $95,000 | $511,029 |
| After 15% tax on the gain | $340,000 | $95,000 | $469,325 |
| Real annual return | 3.21% | −9.98% | 7% |
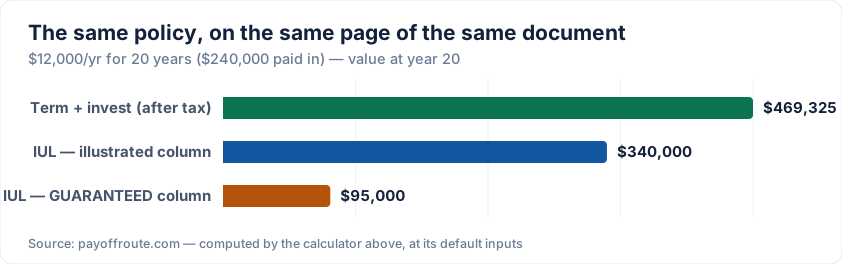
Read the guaranteed column again, because it is the only column with legal force. At year twenty you would have handed the insurer $240,000 and be holding $95,000.
That is not a bad year. That is not a market crash. That is the contract working exactly as written, with the carrier using every lever it is permitted to use: the minimum index credit, the minimum cap, and the maximum cost of insurance.
One column is a projection. The other is a promise.
Everything between them is at the insurer’s discretion. The cap can be lowered. The participation rate can be cut. The cost of insurance can be raised. All unilaterally, all within the contract you signed. Nobody is lying to you. You are being shown the good half of a range and invited not to look at the other half.
Why the cap costs more than the floor saves
The pitch is elegant: the market’s upside, with none of its downside. And the floor is real — in a year the index falls, you are credited 0% instead of losing money. We will not pretend that is worthless.
But look at what the cap does. No assumptions, no modelling, just the crediting rule:
| The index does… | You are credited… | Who keeps the rest |
|---|---|---|
| +24% | 9% | The insurer keeps 15 points |
| +18% | 9% | The insurer keeps 9 points |
| +12% | 9% | The insurer keeps 3 points |
| +4% | 4% | — |
| −18% | 0% | The floor — this part is real |
The floor helps you in a down year. The cap bites in every good one. Most years are up years, so you are surrendering the top of many in exchange for protection in a few.
And there is a second giveaway that never makes it onto a slide: the index credit is normally calculated on the index’s price, which excludes dividends. You track the companies without being paid by them. Over decades, that omission compounds against you quietly and enormously.
The break-even nobody will commit to
Search for the break-even on a max-funded IUL and you will be told it arrives in three to four years, in seven to twelve years, and in fifteen to twenty — by different sellers, on the same afternoon.
They cannot all be right. And none of them can see your policy.
The break-even is not a matter of opinion. It is the year your cash value first exceeds what you have paid in — and your illustration prints the numbers to compute it. On our defaults, the illustrated column is $100,000 above break-even at year twenty.
The guaranteed column is $145,000 below it, and never breaks even at all.
What is actually true about an IUL
It is not a fraud, and we will not call it one. It is a legitimate, state-regulated product that does exactly what the contract says: it pays a death benefit, it credits interest with a floor of zero, and it grows tax-deferred. If you have already filled a 401(k) and an IRA, you have a genuine estate-planning need, and you go in understanding that the cap and the cost of insurance belong to the insurer — then it is a real product with a real use, and none of the arithmetic above argues with that.
“Tax-free retirement income” is a different claim, and it is the one being sold. It says an IUL is a superior place to build wealth than the boring, cheap, tax-advantaged accounts you already have. That claim is what the numbers refuse — and the guaranteed column refuses it in the carrier’s own handwriting, on the same page, in a column your agent did not turn to.
And one last thing, which for most readers should settle it: an IUL is sold by someone earning a commission worth a large share of your first year’s premium. That does not make them dishonest. It does mean the person explaining the two columns to you is the last person on earth who can afford to explain them properly.
So turn the page yourself. Both numbers are already printed.
Methodology: the real annual return of each column is the internal rate of return of an annuity-due — premiums paid at the start of each year — solved by bisection against the cash value printed on the illustration. We do not model the policy’s internals; they are carrier-specific and proprietary, and any figure we invented would be an assumption presented as a fact. The buy-term-and-invest comparison holds the death benefit and the annual outlay identical and taxes the entire investment gain at the capital gains rate, which overstates the tax you would actually pay. The cap table is the crediting rule itself and involves no assumptions. Reproduce any figure in the IUL calculator.
Run your own numbers
Pay Off Debt or Invest Calculator
The eternal question, answered with your numbers: guaranteed interest savings vs expected market returns, compared at the same finish line.
Open calculator →IUL Calculator — Illustrated vs Guaranteed
Your illustration prints two columns. The agent showed you one. Enter both and we print the real annual return of each — plus the break-even the sales pages cannot agree on.
Open calculator →Infinite Banking Calculator
Bring your own illustration. We print the one number it never does — your policy’s real annual return — and price it against buying term and investing the difference.
Open calculator →Disclaimer: This article is for educational purposes only and is not financial advice. Figures are computed with the models described on our methodology page; actual loan terms depend on your lender and circumstances.