The two columns
Every indexed universal life illustration contains at least two projections of the same policy, printed side by side, on the same page of the same document.
- The illustrated column — sometimes labelled “non-guaranteed” — assumes the index performs well, the cap stays where it is today, and the cost of insurance stays at today’s rate.
- The guaranteed column assumes the carrier does everything the contract permits and nothing more: the minimum index credit, the minimum cap, and the maximum cost of insurance.
Only one of those is enforceable. Everything between them is at the insurer’s discretion: the cap can be lowered, the participation rate cut, the cost of insurance raised — unilaterally, and within the contract you signed.
One column is a projection. The other is a promise.
Nobody is lying to you. You are being shown the good half of a range and invited not to look at the other half. So look at it, and put both numbers in the boxes above.
What each column is actually earning
An illustration prints dollars, never rates. That is not an oversight — the rate is not a flattering number, and it is easy to compute: you paid a known amount, for a known number of years, and ended with a known balance.
| Illustrated | Guaranteed | Term + invest | |
|---|---|---|---|
| Paid in over 20 years | $240,000 | $240,000 | $240,000 |
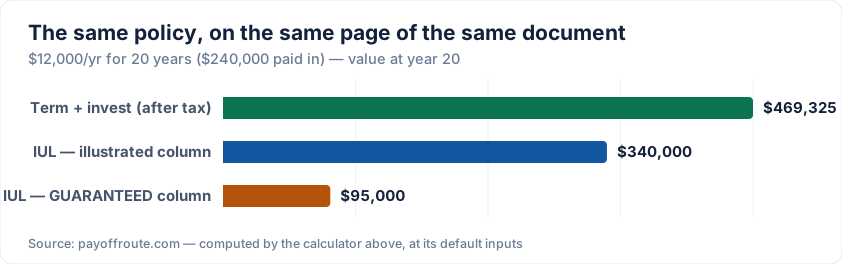
| Value at year 20 | $340,000 | $95,000 | $511,029 |
| After 15% tax on the gain | $340,000 | $95,000 | $469,325 |
| Real annual return | 3.21% | −9.98% | 7% |
The gap between the two columns is $245,000 — on a policy you paid $240,000 into. And note what the guaranteed column means: at year twenty you would have handed over $240,000 and be holding $95,000. That is not a slow investment. That is a loss of −9.98% a year, guaranteed by contract to be no worse, and no better than whatever the insurer decides.
Meanwhile, buying $500,000 of term for $350 a year and investing the other $11,650 at 7% leaves you with $469,325 after paying capital gains tax on every dollar of the gain — harsher than reality, since you would only pay tax on what you sold. That is $129,325 ahead of the illustrated column, and $374,325 ahead of the guaranteed one. Your investments would need to earn just 3.95% to beat even the optimistic column.
Why the cap costs more than the floor saves
The pitch is elegant: you get the market’s upside with none of its downside. The floor is real — in a year the index falls, you are credited 0% rather than losing money, and we will not pretend that is worthless. But look at what the cap does, with no assumptions required:
| The index does… | You are credited… | Who keeps the rest |
|---|---|---|
| +24% | 9% | The insurer keeps 15 points |
| +18% | 9% | The insurer keeps 9 points |
| +12% | 9% | The insurer keeps 3 points |
| +4% | 4% | — |
| −18% | 0% | The floor — this part is real |
The floor helps you in a down year. The cap bites in every good one. Most years are up years, so you are surrendering the top of many in exchange for protection in a few — and the cap is not fixed. It is set by the insurer, and it can be lowered.
There is a second giveaway that never appears in a sales presentation: the index credit is normally calculated on the index’s price, which excludes dividends. You are tracking the index without being paid by the companies in it. Check your policy for the exact crediting method — and if you want the real thing, our pay off debt or invest calculator prices a plain index fund without the wrapper.
The break-even nobody will commit to
Search for “max funded IUL” and you will be told the policy breaks even in three to four years, in seven to twelve, and in fifteen to twenty — by different sellers, on the same afternoon. They cannot all be right, and none of them can see your policy.
The break-even is not a matter of opinion. It is the year your cash value first exceeds what you have paid in, and your own illustration prints the numbers to compute it. This calculator does. If the real return it reports is negative, you have not broken even — whatever the brochure said, and whichever column you are reading.
What is actually true about an IUL
It is not a fraud. It is a legitimate, state-regulated product that does what the contract says: it pays a death benefit, it credits interest with a floor of zero, and it grows tax-deferred. If you have already maxed out a 401(k) and an IRA, you have a genuine estate planning need, and you understand that the cap and the cost of insurance are the insurer’s to change — then it is a real product with a real use, and the numbers above are not an argument against it.
“Tax-free retirement income” is a different claim, and it is the one being sold. It says an IUL is a superior place to build wealth than the plain, boring, tax-advantaged accounts you already have access to. That claim is what the arithmetic refuses — and the guaranteed column refuses it in the carrier’s own handwriting.
One last thing, and for most readers it should settle the matter: an IUL is sold by someone earning a commission worth a large share of your first year’s premium. That does not make them dishonest. It does mean the person explaining the two columns to you is the last person who can afford to explain them properly. If the policy is as good as the presentation, it will survive you typing both numbers into this page. If it is not, you will find out here rather than in twenty years.
For the closely-related “be your own bank” pitch built on whole life, our infinite banking calculator runs the same arithmetic on that product.
Frequently Asked Questions
What are the two columns on my illustration?
Every indexed universal life illustration prints at least two projections of the same policy. The ILLUSTRATED (or "non-guaranteed") column assumes the index performs well, the cap stays where it is today, and the cost of insurance stays at today’s rate. The GUARANTEED column assumes the carrier does everything it is contractually allowed to do and nothing more: the minimum index credit, the minimum cap, and the MAXIMUM cost of insurance. One is a projection. The other is a promise — and it is the only one that is enforceable. Your agent almost certainly showed you the first.
Is the guaranteed column realistic, or is it just a worst case?
It is a worst case, and that is precisely why it matters: it is the only scenario the carrier is obliged to deliver. Everything between the two columns is at the insurer’s discretion. The cap can be lowered, the participation rate can be cut, and the cost of insurance can be raised — all unilaterally, within the contract. You are not being lied to. You are being shown the good half of a range and asked not to look at the other half.
Why does the cap hurt so much if the floor protects me?
Because the floor only helps in a down year, while the cap bites in every good one. If the index rises 24% and your cap is 9%, you are credited 9% and the insurer keeps the other fifteen points. If it falls 18%, you are credited 0% — and that floor is a real, genuine feature; we will not pretend otherwise. But most years are up years, so you are trading away the top of many years to be protected in a few. There is a second, quieter giveaway too: the index credit is normally calculated on the index PRICE, which excludes dividends. Over decades that omission compounds against you.
The sales pages give different break-even years. Which is right?
None of them, because none of them can see your policy. Search "max funded IUL" and you will find break-evens quoted as three to four years, seven to twelve years, and fifteen to twenty — usually by people selling the policy. The break-even is not a matter of opinion: it is the year your cash value first exceeds what you have paid in, and your own illustration prints the numbers to compute it. This calculator does. If the real return it reports is negative, you have not broken even, whatever the brochure said.
Does this calculator store my information?
No. Every calculation runs entirely in your browser. Nothing you enter is saved, stored, or sent to any server.
Read more on this
Related calculators
Personal Loan
Monthly payment and true total cost of a personal loan, including the origination fee most calculators ignore.
Open calculator →Loan Payoff
See how much sooner you’ll be debt-free and how much interest you save by adding extra monthly or one-time payments to any loan.
Open calculator →Student Loan Payoff
See when your student loans actually end — and how extra payments or one-time windfalls move the date and shrink the interest.
Open calculator →Disclaimer: This calculator is for educational purposes only and provides estimates based on the numbers you enter. It is not financial, legal, or tax advice. Actual loan terms, rates, and payments depend on your lender and personal circumstances. All calculations run in your browser — nothing you enter is stored or sent anywhere.