Mortgage Points vs a Bigger Down Payment: The 4-Point Ceiling Nobody Mentions
Search “mortgage points vs down payment” and you will find Chase, Rocket Mortgage, Bankrate and PenFed all answering the same way: if you are below 20% down, put the cash toward the down payment — you might get rid of PMI. Every one of those articles then ends by advising you to “calculate your break-even point,” and not one of them calculates it.
So we did. And the first thing the arithmetic says is that the advice describes a choice most buyers do not have. Every figure below comes from the same engine that powers our calculators; the methodology is public, and you can reproduce any row in the mortgage points vs down payment calculator.
Key findings
- The points bucket is far too small to hold the cash in question. A buyer at 10% down on a $400,000 home needs $40,000 to reach 20%. Points can absorb at most $13,333 of it — absorbing the rest would take 11.1 points, and lenders sell four. The other $26,667 goes into the down payment whichever option they pick.
- The two options are therefore not rivals, and the stake is a third of what it looks like. It only becomes a genuine either/or once you are within ~3 points of 20%. Worse, the 10%-down buyer who “buys points” still lands at 16.7% down — and still pays PMI.
- The interest rate barely matters. The point pricing decides everything. Sweep the rate from 5.5% to 8% and the break-even moves 7 months. Sweep what a point buys from 0.375% to 0.125% and it moves 151 months.
- The points path can have the lower monthly payment and still lose. On our defaults it is $131.92/month cheaper — and it is still $6,572 behind if you sell in year three.
- The PMI cliff, when you can actually reach it, is worth 29 months. It pushes the points break-even out from 5 yr 5 mo to 7 yr 10 mo.
The ceiling
A discount point costs 1% of the loan amount and buys roughly a quarter-point off the rate. Lenders cap them — rate sheets typically stop somewhere around three or four points, because beyond that the pricing stops making sense for the lender. That cap is a hard ceiling on the entire points strategy: the most cash you can possibly route into points is about 4% of the loan, which is roughly 3.6% of the purchase price.
Now hold that number up against the advice. Take a buyer on a $400,000 home who has scraped together exactly what the advice demands — enough cash to reach 20% down. How much of it can the points bucket actually swallow?
| Your down payment | Cash needed to reach 20% | Most of it points can absorb | Forced into the down payment anyway | A real either/or? |
|---|---|---|---|---|
| 5% | $60,000 | $13,333 | $46,667 | No |
| 10% | $40,000 | $13,333 | $26,667 | No |
| 15% | $20,000 | $13,333 | $6,667 | No |
| 16% | $16,000 | $13,333 | $2,667 | No |
| 17% | $12,000 | $12,000 | $0 | Yes |
| 19% | $4,000 | $4,000 | $0 | Yes |
Read the fourth column. A buyer at 10% down who has the $40,000 that reaching 20% requires can divert at most $13,333 of it into points. The other $26,667 goes into the down payment no matter which option they “choose.” To absorb the whole $40,000 in points, they would have to buy 11.1 points. From 5% down, 15.8 points. Lenders sell four.
So the choice being described to them does not exist. They were never picking $40,000 into points or $40,000 into the house. They were picking between:
- max out the points, and the leftover goes down anyway, or
- skip the points, send it all down.
And the gap between those two is only the $13,333 the cap lets them divert. The stake is a third of what it appears to be. The decision only becomes a genuine either/or once you are within about three percentage points of 20%, where the cash needed finally fits inside the points bucket.
There is a second sting in that table. The 10%-down buyer who takes the points path ends up at 16.7% down — still under the line, still paying PMI. They bought a lower rate and kept the mortgage insurance. Only the down-payment path clears 20%.
This is the fork our calculator models. On its defaults — a $400,000 home, $40,000 already down, $20,000 spare — the “buy points” path spends $14,167 on the maximum 4 points and then puts the remaining $5,833 into the down payment, because there is nowhere else for it to go.
The number that decides it is not the rate
Buyers shop rates. Lenders advertise rates. Every comparison site ranks by rate. And for this decision, the rate is close to irrelevant.
What decides it is the rate reduction per point — the price of the discount, which appears as a specific dollar cost paired with a specific rate on page two of your Loan Estimate, and which almost nobody reads. Hold that pricing at the conventional 0.25% and sweep the interest rate across a range that would qualify as a generational move — 5.5% to 8.0% — and the break-even hardly stirs:
| Rate (at 0.25% per point) | Break-even |
|---|---|
| 5.50% | 5 yr 2 mo |
| 6.75% | 5 yr 5 mo |
| 8.00% | 5 yr 9 mo |
Seven months of movement, across 250 basis points. Now freeze the rate and move the pricing instead:
| What a point buys (at 6.75%) | Break-even |
|---|---|
| 0.125% | 15 yr 10 mo |
| 0.25% | 5 yr 5 mo |
| 0.375% | 3 yr 3 mo |
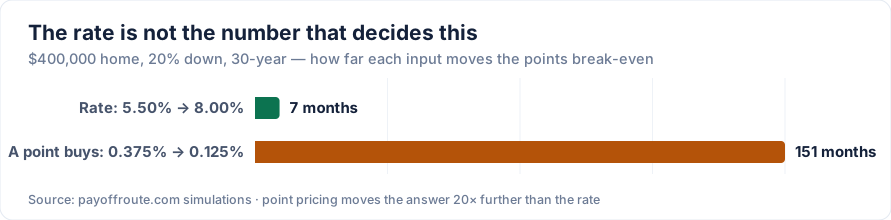
Twenty times the leverage. At 0.125% per point the break-even is longer than almost anyone keeps a mortgage, which means the points are not a slow investment — they are simply a loss. At 0.375% they pay for themselves before the average buyer has repainted the kitchen. Same house, same rate, same cash. The entire answer flipped on a line item most buyers never look at.
The practical consequence: when you are handed a Loan Estimate, the question is not “what rate did I get?” but “what does one point buy me here?” — and it is worth asking two or three lenders on the same day, because point pricing varies between lenders far more than headline rates do. If a point buys you an eighth of a percent, you are done; the answer is no.
Money spent on points is gone. Money put down is still in the house.
Here is the finding that surprised us most, and it is the one to remember.
Compare the two paths on our defaults. Both buyers bring exactly $60,000 to closing. One spends $14,167 of it on 4 points and puts $45,833 down; the other puts all $60,000 down.
| Buy points | Bigger down payment | |
|---|---|---|
| Cash at closing | $60,000 | $60,000 |
| Down payment | $45,833 (11.5%) | $60,000 (15.0%) |
| Loan amount | $354,167 | $340,000 |
| Rate | 5.75% | 6.75% |
| Monthly payment incl. PMI | $2,229.15 | $2,361.07 |
| Total cost over 3 years | $419,925 | $413,353 |
| Total cost over 7 years | $502,147 | $502,955 |
The points buyer pays $131.92 less every single month — and is still $6,572 behind if they sell in year three.
That looks like a contradiction until you notice the term almost every comparison omits: the balance you still owe on the day you leave. Both houses sell for the same price. But the down-payment buyer’s $14,167 is still inside the house, reducing the mortgage they have to pay off. The points buyer’s $14,167 went to the lender at closing and no longer exists anywhere. The lower payment is real; it was just bought with money that has been permanently deleted.
So the comparison that works is:
Total cost = principal & interest paid + PMI paid + balance still owed when you leave
Both paths spent identical cash, so the cash cancels and this is what is left. On that measure the crossover — for these inputs — lands at 6 yr 9 mo:
| If you leave after… | Buy points | Bigger down payment | Winner |
|---|---|---|---|
| 3 years | $419,925 | $413,353 | Down payment by $6,572 |
| 5 years | $462,282 | $460,530 | Down payment by $1,752 |
| 7 years | $502,147 | $502,955 | Points by $808 |
| 10 years | $554,901 | $563,690 | Points by $8,788 |
| 30 years | $756,555 | $802,922 | Points by $46,368 |
Note the seven-year row: $808 apart, or 0.16% of the total. Anyone who tells you one of these options is obviously correct has not run the numbers. For a huge swath of realistic buyers this is very nearly a coin flip, and it is decided entirely by a horizon they cannot actually predict.
What the PMI cliff is really worth
When you can reach 20%, how much is it worth? We isolated it: take a buyer at 18% down with exactly enough spare cash to cross, then re-run the same buyer in a world with no PMI at all. The difference is the cliff, cleanly.
- With PMI at 0.55%: points break even at 7 yr 10 mo
- With no PMI in the model: points break even at 5 yr 5 mo
The cliff is worth 29 extra months of required tenure before points can catch up. That is substantial — for a buyer who honestly expects to move or refinance within a decade, it is usually decisive.
But it is smaller than its reputation, for a reason people forget: PMI expires on its own. It is not a lifetime cost you are buying your way out of. On our defaults it falls off by itself at month 58 on the down-payment path and month 77 on the points path, once scheduled amortization drags the balance to 80% of the price. You are buying your way out of roughly five years of it, not thirty.
(Two honest caveats. We assume you request cancellation the month the scheduled balance reaches 80%, which is your right under the Homeowners Protection Act if your payments are current; if you never ask, the servicer must terminate it automatically at 78% — later, and more expensive, so ask. And this is conventional PMI. FHA mortgage insurance follows different rules and on most modern FHA loans never comes off at all — which is an argument for reaching 20% and taking a conventional loan, not an argument for points.)
The honest version
Strip out the arithmetic and three cases remain.
If you can actually reach 20% down, do it. The cliff plus the smaller balance is a lot to overcome, and — unlike points — the money comes back to you when you sell.
If you cannot reach 20% and you are genuinely confident you will hold this exact loan past the break-even month, buy the points. But say the number out loud first. “This exact loan” means no move, no refinance, no job in another city, no second child, for six or seven years. Most people who say yes to that are wrong.
If you are unsure, put it down. That is the reversible choice. The money is still yours, sitting in the house, and it comes back at closing. Points are a bet you cannot unwind — and if you refinance two years later, you set fire to the entire purchase.
And the option that is on none of these charts: keep the cash. Neither column here is an emergency fund. A buyer who spends their last liquid dollar on a marginally better mortgage has traded a small, certain saving for a large, uncertain risk — and that is a bad trade no calculator on this site will ever recommend.
Methodology: all figures computed with standard monthly amortization. PMI is modelled as a flat monthly premium on the original loan balance, charged until scheduled amortization brings the balance to 80% of the purchase price. Both paths are constrained to spend identical cash at closing, and total cost includes the balance still outstanding at the horizon, so the two are compared on like-for-like terms. Point purchases are capped at the lender’s maximum (default 4) with any excess cash routed to the down payment. Taxes are not modelled: discount points on a purchase may be deductible in the year paid if you itemise, which would shorten the break-even somewhat. Reproduce any figure in the mortgage points vs down payment calculator.
Run your own numbers
Mortgage Points Calculator
Are discount points worth it? Break-even month and lifetime savings for buying down your rate — before you hand over cash at closing.
Open calculator →Mortgage Points vs Down Payment Calculator
Same cash, two destinations. Buy down the rate or shrink the loan — with the PMI cliff, the point cap, and the month one finally overtakes the other.
Open calculator →15 vs 30 Year Mortgage Calculator
The classic trade-off, quantified: payments, lifetime interest, and the hybrid nobody mentions — a 30-year paid like a 15.
Open calculator →Disclaimer: This article is for educational purposes only and is not financial advice. Figures are computed with the models described on our methodology page; actual loan terms depend on your lender and circumstances.